
We found this a site online Websites as Graphs. You can enter your URL and it will map your homepage as a graph showing how your links, tables, forms etc fit together. It's pretty nifty and you can watch the tree growing in front of you. It provided hours of mindless entertainment in the office.
This is what my blog looks like:
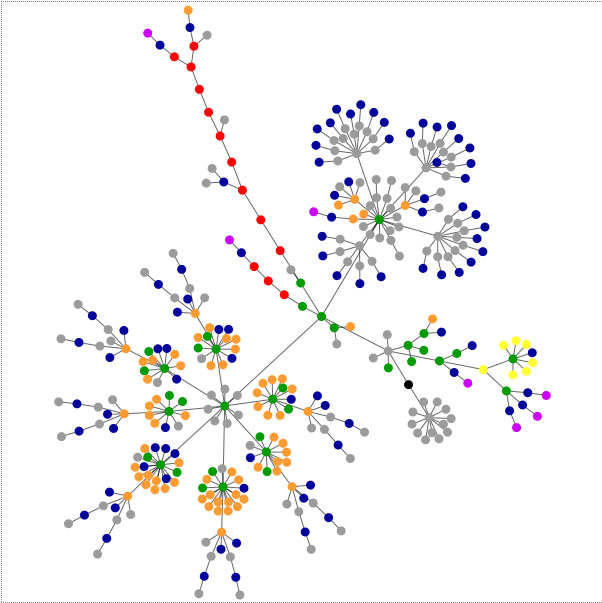
This is what the colours mean:
What do the colors mean?
blue: for links (the A tag)
red: for tables (TABLE, TR and TD tags)
green: for the DIV tag
violet: for images (the IMG tag)
yellow: for forms (FORM, INPUT, TEXTAREA, SELECT and OPTION tags)
orange: for linebreaks and blockquotes (BR, P, and BLOCKQUOTE tags)
black: the HTML tag, the root node
gray: all other tags
posted by Cat Murray @ 15:37
![]()
![]()


0 Comments:
Post a Comment
<< Home